3. Modes of Operation
3.1. Constant Current Mode
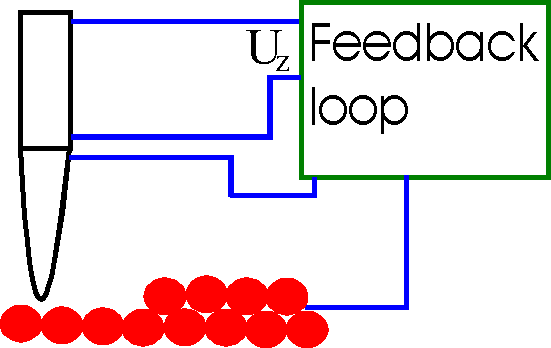 |
By using a feedback loop the tip is vertically adjusted in such a way that the current always stays constant. As the current is proportional to the local density of states, the tip follows a contour of a constant density of states during scanning. A kind of a topographic image of the surface is generated by recording the vertical position of the tip. |
3.2 Constant Height Mode
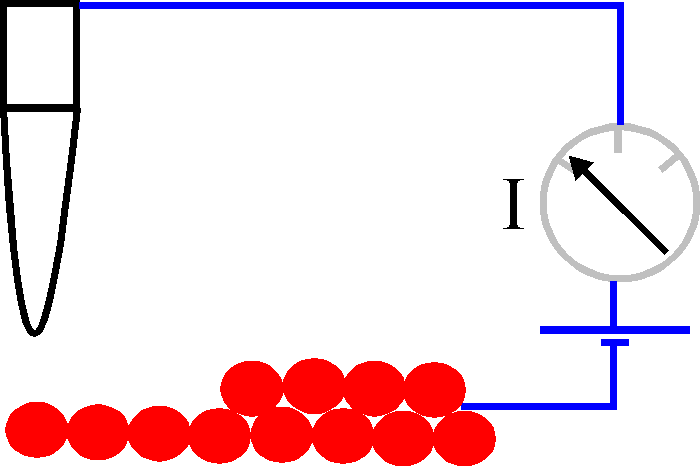 |
In this mode the vertical position of the tip is not changed, equivalent to a slow or disabled feedback. The current as a function of lateral position represents the surface image. This mode is only appropriate for atomically flat surfaces as otherwise a tip crash would be inevitable. One of its advantages is that it can be used at high scanning frequencies (up to 10 kHz). In comparison, the scanning frequency in the constant current mode is about 1 image per second or even per several minutes. |
3.3 Barrier Height Imaging
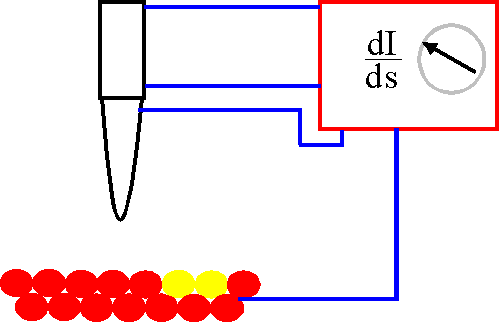 |
Up to now homogoneous surfaces were considered. If there is an inhomogeneous compound in the surface the work function will be inhomogeneous as well. This alters the local barrier height. By using the two modes described above we would get a virtual hole or adatom. But this can further be explored: Differentiation of (*) yields
Thus the work function can directly be measured by variing the tip-sample distance, which can be done by modulating the current with the feedback turned on. |
3.4 Scanning Tunneling Spectroscopy
If the matrix element and the density of states of the tip is nearly constant, the tunneling current (**) can be estimated to
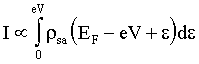
Differentiation yields the density of states
![]()
The density of states can be deduced by
- Modulation of the bias voltage
- Current-Imaging Tunneling Spectroscopy (CITS): The tip is scanned in the constant current mode to give a constant distance to the sample. At each point the feedback loop is disabled and a current-voltage curve (I+V curve) is recorded.